Sales of newly built, single-family homes rose 12.2% in 2016 to 563,000 units, the highest annual rate since 2007, according to newly released data by the U.S. Department of Housing and Urban Development and the U.S. Census Bureau. New home sales fell 10.4% in December 2016 to a seasonally adjusted annual rate of 536,000 units.
“We are encouraged by the growth in the housing sector last year, and by the fact that builders increased inventory by 10% in anticipation of future business,” said Robert Dietz, chief economist of the National Association of Home Builders. “National Association of Home Builders’ forecast calls for continued upward momentum this year, with housing starts expected to rise 10% over the course of 2017.”
“To ensure sales continue to move forward in 2017, builders need to price their homes competitively, especially given that mortgage interest rates are expected to rise this year,” said National Association of Home Builders Chairman Granger MacDonald.
The inventory of new home sales for sale was 259,000 in December, which is a 5.8-month supply at the current sales pace. The median sales price of new houses sold was $322,500.
Regionally, new home sales increased 48.4% in the Northeast. Sales fell 1.3% in the West, 12.6% in the South and 41% in the Midwest.

The Home Builders Association of Greenville are your neighbors and community leaders providing education and support for building industry professionals. We create jobs, encourage homeownership, and promote responsible growth throughout the upstate of South Carolina.
Friday, January 27, 2017
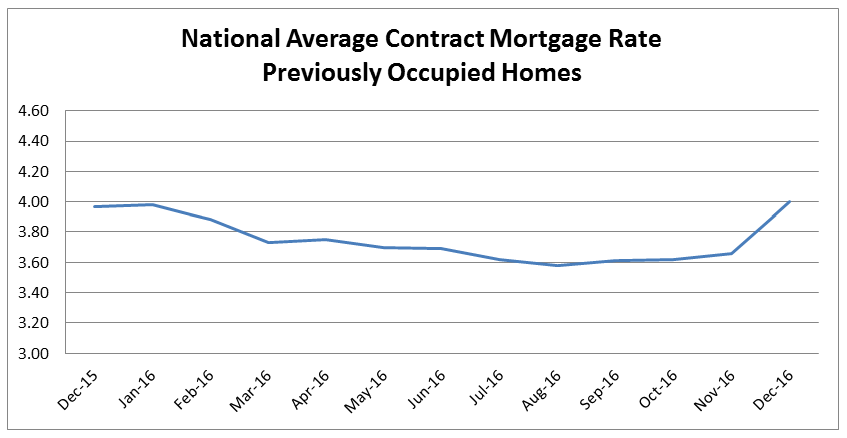
FHFA Index Shows Mortgage Rates Increased in December
From the Federal Housing Finance Agency:
The National Average Contract Mortgage Rate for the Purchase of Previously Occupied Homes by Combined Lenders Index was 4.00 percent for loans closed in late December, up 34 basis points from 3.66 percent in November.
The average interest rate on all mortgage loans was 3.91 percent, up 27 basis points from 3.64 in November.
The average interest rate on conventional, 30-year, fixed-rate mortgages of $417,000 or less was 4.08 percent, up 28 basis points from 3.80 in November.
The effective interest rate on all mortgage loans was 3.99 percent in December, up 22 basis points from 3.77 in November. The effective interest rate accounts for the addition of initial fees and charges over the life of the mortgage.
The average loan amount for all loans was $319,100 in December, up $4,400 from $314,700 in November.
Federal Housing Finance Agency will release January index values Tuesday, February 28, 2017.
To find the complete contract rate series, go to https://www.fhfa.gov/DataTools/Downloads/Pages/Monthly-Interest-Rate-Data.aspx.
Source: FHFA
Technical note: The indices are based on a small monthly survey of mortgage lenders, which may not be representative. The sample is not a statistical sample but is rather a convenience sample. Survey respondents were asked to report terms and conditions of all conventional, single-family, fully amortized purchase-money loans closed during the last five working days of the month. Unless otherwise specified, the indices include 15-year mortgages and adjustable-rate mortgages. The indices do not include mortgages guaranteed or insured by either the Federal Housing Administration or the U.S. Department of Veterans Affairs. The indices also exclude refinancing loans and balloon loans. December 2016 values are based on 3,727 reported loans from 13 lenders, which include savings associations, mortgage companies, commercial banks, and mutual savings banks.
Wednesday, January 25, 2017
Greer Commission of Public Works Selects New General Manager
The Greer Commission of Public Works announced Michael Richard as the next general manager to lead the company, replacing Jeff Tuttle, who left in November. Richard will finish out his obligation with his current employer before starting at Greer CPW on March 6.
“Mike’s educational background plus his significant management experience proved to be a strong combination as we narrowed the field of national candidates. We know Mike is a great fit with Greer’s four utility system and the Commission welcomes the Richard family to the Greer community,” said Perry J. Williams, CPW chairman, in the release.
“My wife Cindi has family in the Wilmington, N.C. area and we’ve always loved the Carolinas. We are excited to be closer to family and continue the great foundation already set in Greer,” said Richard, in the release.
Remodeling Market Might Ease Off the Gas
A recovering economy is great news for the majority of Americans, though for many remodelers, it is a sign they might need to adjust the way they do business … again.
The economic downturn forced remodelers to adopt new strategies to survive in a changing market — strategies that generally led to sustained profit growth.
The newly released 2017 Remodelers’ Cost of Doing Business Study shows that the average gross profit margin for remodelers increased from 26.8% to 28.9% between 2011 and 2015. Average net profit margin increased as well, rising from 3.0% to 5.3% during that same period.
Now that spending is back up and consumers are increasingly interested in buying new (or newer) homes, remodeling expenditures are likely to grow at a more gradual pace than in recent years, according to comments made in January 2017 by National Association of Home Builders economist Paul Emrath during a press conference at the International Builders’ Show.
That means remodelers will have to identify new ways to maintain their share of the market.
“Pacific Northwest consumers are tech-savvy and community-minded,” said National Association of Home Builders Remodelers member Joseph Irons, CAPS, CGP, GMR, a remodeler from Shoreline, Wash. “We’ve reduced costs while growing our business by focusing on social media outreach and community service over traditional advertising.”
The Remodelers’ Cost of Doing Business Study assesses the growth, viability, and demographics of the remodeling industry. The 2017 study was conducted through an online survey sent out to 5,700 residential remodeling/rehabilitation firms across the country in the spring of 2016.
The full study is available for purchase at builderbooks.com. National Association of Home Builders Remodelers members are eligible for a 20% discount off the member price.
FHFA House Price Index Up 0.5 Percent in November
From the Federal Housing Finance Agency:
U.S. house prices rose in November, up 0.5 percent on a seasonally adjusted basis from the previous month, according to the Federal Housing Finance Agency monthly House Price Index. The previously reported 0.4 percent increase in October was revised downward to a 0.3 percent increase.
The Federal Housing Finance Agency monthly House Price Index is calculated using home sales price information from mortgages sold to, or guaranteed by, Fannie Mae and Freddie Mac. From November 2015 to November 2016, house prices were up 6.1 percent.
For the nine census divisions, seasonally adjusted monthly price changes from October 2016 to November 2016 ranged from -0.2 percent in the South Atlantic division to +1.5 percent in the Pacific division. The 12-month changes were all positive, ranging from +4.7 percent in the Middle Atlantic division to +7.7 percent in the Pacific division.
Monthly index values and appreciation rate estimates for recent periods are provided in the table and graphs on the following pages. Complete historical downloadable data and House Price Index release dates for 2017 are available on the House Price Index page.
For detailed information on the House Price Index, see House Price Index Frequently Asked Questions. The next House Price Index report will be released February 23, 2017 and will include quarterly data for the fourth quarter of 2016 and monthly data through December 2016.
U.S. House Price Index - November 2016
From the Federal Housing Finance Agency:
The Federal Housing Finance Agency House Price Index reported a 0.5 percent increase in U.S. house prices in November from the previous month. From November 2015 to November 2016, house prices were up 6.1 percent. For the nine census divisions, seasonally adjusted monthly price changes from October 2016 to November 2016 ranged from -0.2 percent in the South Atlantic division to +1.5 percent in the Pacific division. The 12-month changes were all positive, ranging from +4.7 percent in the Middle Atlantic division to +7.7 percent in the Pacific division.
Monthly index values and appreciation rate estimates for recent periods are provided in the table and graphs in the attachment.
Subscribe to:
Comments (Atom)