by Rob Dietz, Chief Economist, National Association of Home Builders
The most serious headwind facing housing markets today is the escalation of framing lumber prices—up 59% since the start of 2017. Recent NAHB surveys suggest the price for lumber has overtaken the availability of labor as the primary business challenge for home builders. Since the beginning of last year, rising lumber prices have added more than $7,000 to the price of a typical new home and more than $2,000 to the price of a typical apartment.
There are a number of reasons why lumber prices have jumped, including a rail car shortage in Canada, but the primary factor is the 21% effective tariff rate placed on Canadian softwood lumber. The ongoing concerns over trade wars represent a macroeconomic risk to the gains resulting from the recent tax legislation, and lumber is a prime example.
Nonetheless, builder confidence remains strong, despite total housing starts falling 3.7% in April. Though multifamily starts declined 11% last month, that market is up 10% year-to-date, outperforming our forecast. And single-family starts are 8% above their year-to-date totals from a year ago. However, recent data show a gain in average new-home size, which is an early indicator of weakness in the entry-level market due to rising input costs.

The Home Builders Association of Greenville are your neighbors and community leaders providing education and support for building industry professionals. We create jobs, encourage homeownership, and promote responsible growth throughout the upstate of South Carolina.
Showing posts with label Housing Economics. Show all posts
Showing posts with label Housing Economics. Show all posts
Wednesday, June 13, 2018

Monday, July 24, 2017
NAHB Study shows home buying boosts the economy
A new consumer spending analysis from NAHB highlights another reason why home building helps drive a healthy economy: In their first year of ownership, new home buyers spend about $10,601 on appliances, furnishings and home improvement projects — 2.6 times as much as other home owners in a typical year.
NAHB economist Natalia Siniavskaia studied the U.S. Bureau of Labor Statistics Consumer Expenditure Survey to help quantify the wave of activity — and cash — spent to install new refrigerators, buy couches and make other improvements as new owners personalize their homes.
“While construction jobs are the most obvious impact of new homes on the economy, it’s important to realize that it doesn’t stop there,” said NAHB Chairman Granger MacDonald, a home builder and developer in Kerrville, Texas.
“It’s the architects, the heating technicians, the lumber dealers. And it’s the mom-and-pop owners at the local furniture or appliance store who are helping these buyers make their house a home,” he said.
During the first two years after closing on the house, a typical buyer of a newly built single-family home tends to spend on average $4,500 more than a similar non-moving home owner.
A previous NAHB study based on 2004-2007 data collected during the housing boom showed somewhat higher spending by home owners overall. But the tendency of buyers to outspend non-moving owners on appliances, furnishings and home improvements was similar.
In the aggregate, most of the demand for appliances, furnishings and remodeling projects in a given year is generated by non-moving home owners, because they outnumber home buyers by such a wide margin.
But new owners’ impact is noticeable — and vital, MacDonald said. “The health of housing — and new home buying — is key to the overall state of our economy.”
Read Siniavskaia’s Eye on Housing blog post on her findings. See the study here.
NAHB economist Natalia Siniavskaia studied the U.S. Bureau of Labor Statistics Consumer Expenditure Survey to help quantify the wave of activity — and cash — spent to install new refrigerators, buy couches and make other improvements as new owners personalize their homes.
“While construction jobs are the most obvious impact of new homes on the economy, it’s important to realize that it doesn’t stop there,” said NAHB Chairman Granger MacDonald, a home builder and developer in Kerrville, Texas.
“It’s the architects, the heating technicians, the lumber dealers. And it’s the mom-and-pop owners at the local furniture or appliance store who are helping these buyers make their house a home,” he said.
During the first two years after closing on the house, a typical buyer of a newly built single-family home tends to spend on average $4,500 more than a similar non-moving home owner.
A previous NAHB study based on 2004-2007 data collected during the housing boom showed somewhat higher spending by home owners overall. But the tendency of buyers to outspend non-moving owners on appliances, furnishings and home improvements was similar.
In the aggregate, most of the demand for appliances, furnishings and remodeling projects in a given year is generated by non-moving home owners, because they outnumber home buyers by such a wide margin.
But new owners’ impact is noticeable — and vital, MacDonald said. “The health of housing — and new home buying — is key to the overall state of our economy.”
Read Siniavskaia’s Eye on Housing blog post on her findings. See the study here.
Friday, July 21, 2017
U.S. house prices rise 1.4 percent in the first quarter
U.S. house prices rose 1.4 percent in the first quarter of 2017 according to the Federal Housing Finance Agency (FHFA) House Price Index (HPI). House prices rose 6.0 percent from the first quarter of 2016 to the first quarter of 2017. FHFA's seasonally adjusted monthly index for March was up 0.6 percent from February.
The HPI is calculated using home sales price information from mortgages sold to, or guaranteed by, Fannie Mae and Freddie Mac. FHFA has produced a video of highlights for this quarter.
"The steep, multi-year rise in U.S. home prices continued in the first quarter," said FHFA Deputy Chief Economist Andrew Leventis. "Mortgage rates during the quarter remained slightly elevated relative to most of last year, but demand for homes remained very strong. With housing inventories still languishing at extremely low levels, the strong demand led to another exceptionally large quarterly price increase."
Significant Findings
The HPI is calculated using home sales price information from mortgages sold to, or guaranteed by, Fannie Mae and Freddie Mac. FHFA has produced a video of highlights for this quarter.
"The steep, multi-year rise in U.S. home prices continued in the first quarter," said FHFA Deputy Chief Economist Andrew Leventis. "Mortgage rates during the quarter remained slightly elevated relative to most of last year, but demand for homes remained very strong. With housing inventories still languishing at extremely low levels, the strong demand led to another exceptionally large quarterly price increase."
Significant Findings
- Home prices rose in 48 states and the District of Columbia between the first quarter of 2016 and the first quarter of 2017. The top five areas in annual appreciation were: 1) District of Columbia 13.9 percent; 2) Colorado 10.7 percent; 3) Idaho 10.3 percent; 4)Washington 10.2 percent; and 5) New Hampshire 9.5 percent.
- Among the 100 largest metropolitan areas in the U.S., annual price increases were greatest in the Grand Rapids-Wyoming, MI, where prices increased by 13.7 percent. Prices were weakest in San Francisco-Redwood City-South San Francisco, CA (MSAD), where they fell 2.5 percent.
- Of the nine census divisions, the Pacific division experienced the strongest increase in the first quarter, posting a 2.0 percent quarterly increase and a 7.7 percent increase since the first quarter of last year. House price appreciation was weakest in theMiddle Atlantic division, where prices rose 1.0 percent from the last quarter.
Thursday, July 20, 2017
Compliance with regulations account for nearly 25 percent of the cost of a new home
By Bob Barreto, President, Home Builders Association of
Greenville
President, GBS Building Supply
On average, regulations imposed by
all levels of government account for 24.3 percent of the sales price of a new
single-family home, according to a 2016 study by the National Association of
Home Builders (NAHB).
Breaking down the total regulatory
costs further, the study revealed that three fifths of compliance costs, or 14.6
percent of the final house price, is due to a higher price for a finished lot
resulting from regulations imposed during the lot's development. The other two
fifths, or 9.7 percent of the house price, is the result of costs incurred by
the builder when building the home after purchasing the finished lot.
In the Greater Greenville area, the
study indicates that a new home is $67,424 more expensive as a result of the
cost of complying with regulations.

These regulations come from many sources. They include new land-use controls that reduce the potential density yield of a parcel of land, which increases the cost of the finished lot. Other regulations include significant changes to the building code that has added thousands of dollars to the price of a new home. Labor-law changes also have had an impact. As well as significant increases in building permit fees, development compliance fees, and new sewer account fees. But the greatest increase in the cost of compliance has come in the form of new and increased environmental regulations to control erosion and stormwater runoff during development and construction.
When the 2016 study is compared to
a previous study prepared in 2011, NAHB found that the cost of compliance with
regulations increased by 29.8 percent in the five years between the two
studies. That means the cost of
constructing a new home in the Greater Greenville area increased by more than
$20,000, in just five years, to comply with new rules imposed by
government. Meanwhile, personal disposable
income in the U.S. increased by just 14.4 percent during that same time period,
meaning that the average cost of regulation embodied in a new home is rising
more than twice as fast as the average American's ability to pay for it.
According to another study by the
National Association of Home Builders, 521 families in the Greater Greenville
are priced out of Homeownership by a $1,000 increase in the cost of purchasing
a new home. If you do the math, and I
have, that means the increase in the last five years in the cost of compliance
with regulations has priced out of homeownership more than 10,000 families in
our community.
There has been considerable
discussion and debate about affordable housing in our community. Studies by the City of Greenville and
Greenville County are providing evidence of the problem. Many want to blame home builders and land developers
for the problem. But a reading of the
studies by the National Association of Home Builders demonstrates that at least
part of the problem lies with well-meaning regulations that fail to take into
account the impact on a family’s ability to afford a home.
Clearly, a portion of the solution
to our community’s housing affordability problem lies in a thorough review of
the cost of complying with our own regulations.
Monday, June 26, 2017
NAHB: Construction forecast
 Clear skies, chance of headwinds.
Three experts offer their insights on the direction the housing industry will take through the end of the year is now available for viewing.
Plus a look at what to expect in 2018 and 2019 in the exclusive NAHB Construction Forecast Webinar,
The forecast also includes a discussion of current economic matters, the state of housing demand and an update on supply-side constraints as home builders begin to feel the effects of soaring lumber prices.
The speakers:
Plus a look at what to expect in 2018 and 2019 in the exclusive NAHB Construction Forecast Webinar,
The forecast also includes a discussion of current economic matters, the state of housing demand and an update on supply-side constraints as home builders begin to feel the effects of soaring lumber prices.
The speakers:
- Mark Zandi, chief economist, Moody’s Analytics
- Danielle Hale, managing director of research, National Association of Realtors
- Robert Dietz, chief economist, NAHB
Friday, January 27, 2017
FHFA Index Shows Mortgage Rates Increased in December
From the Federal Housing Finance Agency:
The National Average Contract Mortgage Rate for the Purchase of Previously Occupied Homes by Combined Lenders Index was 4.00 percent for loans closed in late December, up 34 basis points from 3.66 percent in November.
The average interest rate on all mortgage loans was 3.91 percent, up 27 basis points from 3.64 in November.
The average interest rate on conventional, 30-year, fixed-rate mortgages of $417,000 or less was 4.08 percent, up 28 basis points from 3.80 in November.
The effective interest rate on all mortgage loans was 3.99 percent in December, up 22 basis points from 3.77 in November. The effective interest rate accounts for the addition of initial fees and charges over the life of the mortgage.
The average loan amount for all loans was $319,100 in December, up $4,400 from $314,700 in November.
Federal Housing Finance Agency will release January index values Tuesday, February 28, 2017.
To find the complete contract rate series, go to https://www.fhfa.gov/DataTools/Downloads/Pages/Monthly-Interest-Rate-Data.aspx.
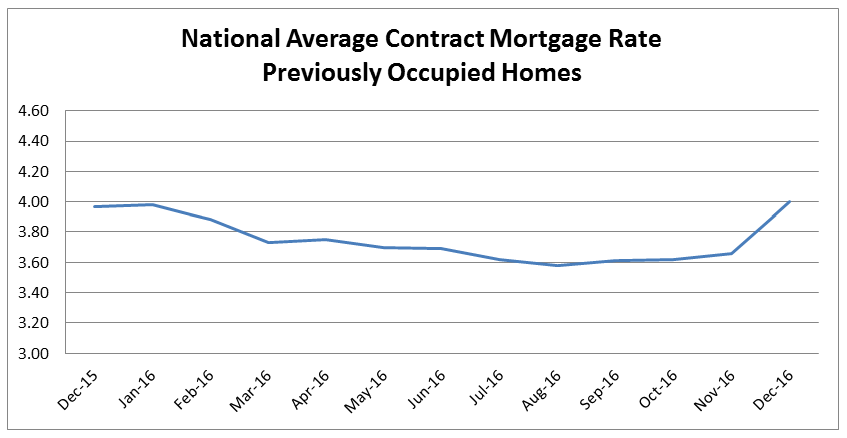
Source: FHFA
Technical note: The indices are based on a small monthly survey of mortgage lenders, which may not be representative. The sample is not a statistical sample but is rather a convenience sample. Survey respondents were asked to report terms and conditions of all conventional, single-family, fully amortized purchase-money loans closed during the last five working days of the month. Unless otherwise specified, the indices include 15-year mortgages and adjustable-rate mortgages. The indices do not include mortgages guaranteed or insured by either the Federal Housing Administration or the U.S. Department of Veterans Affairs. The indices also exclude refinancing loans and balloon loans. December 2016 values are based on 3,727 reported loans from 13 lenders, which include savings associations, mortgage companies, commercial banks, and mutual savings banks.
Wednesday, January 25, 2017
Remodeling Market Might Ease Off the Gas
A recovering economy is great news for the majority of Americans, though for many remodelers, it is a sign they might need to adjust the way they do business … again.
The economic downturn forced remodelers to adopt new strategies to survive in a changing market — strategies that generally led to sustained profit growth.
The newly released 2017 Remodelers’ Cost of Doing Business Study shows that the average gross profit margin for remodelers increased from 26.8% to 28.9% between 2011 and 2015. Average net profit margin increased as well, rising from 3.0% to 5.3% during that same period.
Now that spending is back up and consumers are increasingly interested in buying new (or newer) homes, remodeling expenditures are likely to grow at a more gradual pace than in recent years, according to comments made in January 2017 by National Association of Home Builders economist Paul Emrath during a press conference at the International Builders’ Show.
That means remodelers will have to identify new ways to maintain their share of the market.
“Pacific Northwest consumers are tech-savvy and community-minded,” said National Association of Home Builders Remodelers member Joseph Irons, CAPS, CGP, GMR, a remodeler from Shoreline, Wash. “We’ve reduced costs while growing our business by focusing on social media outreach and community service over traditional advertising.”
The Remodelers’ Cost of Doing Business Study assesses the growth, viability, and demographics of the remodeling industry. The 2017 study was conducted through an online survey sent out to 5,700 residential remodeling/rehabilitation firms across the country in the spring of 2016.
The full study is available for purchase at builderbooks.com. National Association of Home Builders Remodelers members are eligible for a 20% discount off the member price.
The economic downturn forced remodelers to adopt new strategies to survive in a changing market — strategies that generally led to sustained profit growth.
The newly released 2017 Remodelers’ Cost of Doing Business Study shows that the average gross profit margin for remodelers increased from 26.8% to 28.9% between 2011 and 2015. Average net profit margin increased as well, rising from 3.0% to 5.3% during that same period.
Now that spending is back up and consumers are increasingly interested in buying new (or newer) homes, remodeling expenditures are likely to grow at a more gradual pace than in recent years, according to comments made in January 2017 by National Association of Home Builders economist Paul Emrath during a press conference at the International Builders’ Show.
That means remodelers will have to identify new ways to maintain their share of the market.
“Pacific Northwest consumers are tech-savvy and community-minded,” said National Association of Home Builders Remodelers member Joseph Irons, CAPS, CGP, GMR, a remodeler from Shoreline, Wash. “We’ve reduced costs while growing our business by focusing on social media outreach and community service over traditional advertising.”
The Remodelers’ Cost of Doing Business Study assesses the growth, viability, and demographics of the remodeling industry. The 2017 study was conducted through an online survey sent out to 5,700 residential remodeling/rehabilitation firms across the country in the spring of 2016.
The full study is available for purchase at builderbooks.com. National Association of Home Builders Remodelers members are eligible for a 20% discount off the member price.
Thursday, September 29, 2016
NAHB, Business Groups Sue to Block Overtime Rule
National Association of Home Builders and a coalition of more than 55 Texas and national business groups have filed a lawsuit against the U.S. Department of Labor seeking to halt its federal overtime rule set to take effect December 1.
Earlier this year, the Department of Labor issued the rule, which will double the current overtime salary limit of $23,660 to $47,476. It also allows the minimum salary requirements to be raised every three years.
National Association of Home Builders and many groups not in favor of the rule have warned that such a huge jump in such a short period of time could actually hurt a significant number of the workers the rule was meant to help. Many small business owners would be forced to scale back on pay and benefits, as well as cut workers’ hours.
The lawsuit filed on Sept. 20 in the U.S. District Court for the Eastern District of Texas asserts that the Department of Labor exceeded its statutory authority in issuing the regulation and violated the Administrative Procedure Act, which governs the way federal agencies can establish regulations. The legal action seeks to bar the Department of Labor from implementing the rule. A coalition of 21 states this week also filed a separate challenge to the rule in the same court district.
National Association of Home Builders has also been leading the charge to seek a legislative solution and worked closely with Rep. Kurt Schrader (D-Ore.), who recently introduced bipartisan legislation to help small businesses and their workers by mitigating the effects of the overtime rule.
The Overtime Reform and Enhancement Act (H.R. 5813) would allow small businesses operating on tight budgets sufficient time to adjust to the overtime rule by gradually raising the $47,476 threshold under the following timetable.
Moreover, the legislation would eliminate a provision in the rule that requires automatic increases to the overtime salary threshold moving forward. National Association of Home Builders is strongly urging Congress to swiftly pass this legislation.
Earlier this year, the Department of Labor issued the rule, which will double the current overtime salary limit of $23,660 to $47,476. It also allows the minimum salary requirements to be raised every three years.
National Association of Home Builders and many groups not in favor of the rule have warned that such a huge jump in such a short period of time could actually hurt a significant number of the workers the rule was meant to help. Many small business owners would be forced to scale back on pay and benefits, as well as cut workers’ hours.
The lawsuit filed on Sept. 20 in the U.S. District Court for the Eastern District of Texas asserts that the Department of Labor exceeded its statutory authority in issuing the regulation and violated the Administrative Procedure Act, which governs the way federal agencies can establish regulations. The legal action seeks to bar the Department of Labor from implementing the rule. A coalition of 21 states this week also filed a separate challenge to the rule in the same court district.
National Association of Home Builders has also been leading the charge to seek a legislative solution and worked closely with Rep. Kurt Schrader (D-Ore.), who recently introduced bipartisan legislation to help small businesses and their workers by mitigating the effects of the overtime rule.
The Overtime Reform and Enhancement Act (H.R. 5813) would allow small businesses operating on tight budgets sufficient time to adjust to the overtime rule by gradually raising the $47,476 threshold under the following timetable.
- Dec. 1, 2016 – $35,984
- Dec. 1, 2017 – $39,814
- Dec. 1, 2018 – $43,645
- Dec. 1, 2019 – $47,476
Moreover, the legislation would eliminate a provision in the rule that requires automatic increases to the overtime salary threshold moving forward. National Association of Home Builders is strongly urging Congress to swiftly pass this legislation.
TAKING IT LOCAL
National Association of Home Builders Chief Legal Officer Jim Rizzo and Home Builders Association of Greenville CEO Michael Dey will meet with Attorney General Alan Wilson in October. The lawsuit will be among the items discussed.Wednesday, January 6, 2016
New Home Sales Rise 4.3% in November
Sales of newly built, single-family homes rose 4.3% to a seasonally adjusted annual rate of 490,000 units in November, according to newly released data from the U.S. Department of Housing and Urban Development and the U.S. Census Bureau.
“It is encouraging to see new-home sales continue to tick upward,” said NAHB Chairman Tom Woods. “Builders are also increasing their inventory even as they face difficulties accessing lots and labor.”
Regionally, sales rose 20.5% in the West and 4.5% in the South. Sales fell 28.6% in the Northeast and 8.6% in the Midwest.
“Limited gains in new-home sales can be attributed to a weak existing sales report,” said NAHB Chief Economist David Crowe. “People who already own a house comprise most of the new residential construction market, and they often must sell their existing home before making another purchase.”
The inventory of new homes for sale was 232,000 units in November. This is a 5.7-month supply at the current sales pace. This increase in new home sales shows the continuation of growth in the industry.
“It is encouraging to see new-home sales continue to tick upward,” said NAHB Chairman Tom Woods. “Builders are also increasing their inventory even as they face difficulties accessing lots and labor.”
Regionally, sales rose 20.5% in the West and 4.5% in the South. Sales fell 28.6% in the Northeast and 8.6% in the Midwest.
“Limited gains in new-home sales can be attributed to a weak existing sales report,” said NAHB Chief Economist David Crowe. “People who already own a house comprise most of the new residential construction market, and they often must sell their existing home before making another purchase.”
The inventory of new homes for sale was 232,000 units in November. This is a 5.7-month supply at the current sales pace. This increase in new home sales shows the continuation of growth in the industry.
Thursday, November 12, 2015
NAHB: Greenville housing market continues to improve
The economic and housing recovery continues at a slow, but steady pace. For the country as a whole, the Leading Markets Index (LMI) rose to .93 in the third quarter of 2015, .01 point higher than its level in 2015, and .04 point higher than its level from one year ago. The index uses single-family housing permits, employment and home prices to measure proximity to a normal economic and housing market. The index is calculated for both the entire country and for 364 local markets, metropolitan statistical areas (MSAs). A value of 1.0 means the market (or country) is back to the last level of normality.
Greater Greenville
The Greenville area also continues to improve. In the third quarter the index rose .02 to .94. Permits continue to lag at .61, but housing prices are at 1.25 and jobs are at .95. Spartanburg also is at .95, but permits have risen to a much more healthy .78. Charleston is the only marketing in South Carolina that has returned to normal at 1.07 with permits at .80.
Nationally, all three components of the LMI contributed to the quarter-over-quarter growth in the nationwide score. Permits rose from .46 to .47, prices increased from 1.35 to 1.37, and employment rose from .96 to .97. Over the year, the permits, prices, and employment components expanded by .04, .07, and .02 respectively. Regionally, 79 of the 364 markets, 21%, have an LMI Score that is greater than or equal to 1.0 and are considered normal, up from 74 in the second quarter of 2015 and 62 last year.
While most markets do not have an Overall LMI Score that is greater than or equal to 1.0, a recovery in one or more components has taken place across a number of MSAs. For example, in 26 markets single-family permits have returned to normal. This is unchanged from the second quarter, but 5 more than last year’s total. The number of markets where house prices are considered normal was also unchanged over the quarter at 345, but it is 6 greater than the 339 markets from one year ago. Meanwhile, the number of MSAs where employment has reached or exceeded normal reached 72, up from 64 markets in the second quarter and from 40 markets one year ago.
Of the 364 MSAs included in the LMI, 56% saw their score increase over the quarter and 69% recorded year-over-year growth. According to the map above, the MSAs with the largest year-over-year increase, those markets where the annual increase in its LMI Score exceeded that of the nation as a whole, were largely located in the West and in the South, and many reside in the former “bubble” states of California, Nevada, Arizona, and Florida. As illustrated by the first map, many of the markets in these states now have an LMI score closer to the middle of the Score distribution, and off the bottom, indicating that the effects of the crisis in these MSAs are disappearing and the recovery in these markets is taking hold.
Greater Greenville
The Greenville area also continues to improve. In the third quarter the index rose .02 to .94. Permits continue to lag at .61, but housing prices are at 1.25 and jobs are at .95. Spartanburg also is at .95, but permits have risen to a much more healthy .78. Charleston is the only marketing in South Carolina that has returned to normal at 1.07 with permits at .80.
Nationally, all three components of the LMI contributed to the quarter-over-quarter growth in the nationwide score. Permits rose from .46 to .47, prices increased from 1.35 to 1.37, and employment rose from .96 to .97. Over the year, the permits, prices, and employment components expanded by .04, .07, and .02 respectively. Regionally, 79 of the 364 markets, 21%, have an LMI Score that is greater than or equal to 1.0 and are considered normal, up from 74 in the second quarter of 2015 and 62 last year.
While most markets do not have an Overall LMI Score that is greater than or equal to 1.0, a recovery in one or more components has taken place across a number of MSAs. For example, in 26 markets single-family permits have returned to normal. This is unchanged from the second quarter, but 5 more than last year’s total. The number of markets where house prices are considered normal was also unchanged over the quarter at 345, but it is 6 greater than the 339 markets from one year ago. Meanwhile, the number of MSAs where employment has reached or exceeded normal reached 72, up from 64 markets in the second quarter and from 40 markets one year ago.
Of the 364 MSAs included in the LMI, 56% saw their score increase over the quarter and 69% recorded year-over-year growth. According to the map above, the MSAs with the largest year-over-year increase, those markets where the annual increase in its LMI Score exceeded that of the nation as a whole, were largely located in the West and in the South, and many reside in the former “bubble” states of California, Nevada, Arizona, and Florida. As illustrated by the first map, many of the markets in these states now have an LMI score closer to the middle of the Score distribution, and off the bottom, indicating that the effects of the crisis in these MSAs are disappearing and the recovery in these markets is taking hold.
Housing Affordability Rises in Greenville, Falls Nationally
Modest home price and interest rate increases resulted in a slight drop in nationwide housing affordability in the third quarter of 2015, according to the National Association of Home Builders Housing Opportunity Index (HOI).
“Attractive home prices and interest rates, along with firming job growth, are helping housing markets across the country to gradually improve,” said NAHB Chairman Tom Woods, a home builder from Blue Springs, Mo. “While this bodes well for housing in the coming year, builders continue to face challenges, including a lack of available lots and skilled labor.”
“The decline in the index was slight and affordability remains good,” said NAHB Chief Economist David Crowe. “With mortgage rates near historic lows and home prices advancing at a modest pace, this is an excellent time to buy.”
In all, 62.2 percent of new and existing homes sold between the beginning of July and end of September were affordable to families earning the U.S. median income of $65,800. This is down from the 63.2 percent of homes sold that were affordable to median-income earners in the second quarter.
The national median home price increased slightly from $230,000 in the second quarter to $231,000 in the third quarter. Meanwhile, average mortgage rates edged higher from 3.99 percent to 4.18 percent in the same period.
Greenville and the Upstate
The index for Greater Greenville rose to 80 in the second quarter from 77.7 in the first quarter and 73.4 in the same quarter last year. House prices rose slightly while income remained the same. Greater Greenville ranks as the 76th most affordable housing market in the country.
Featured Markets
Syracuse, N.Y. was rated the nation’s most affordable major housing market, switching places with Youngstown-Warren-Boardman, Ohio-Pa., which fell to the second slot on the list. In Syracuse, 91.7 percent of all new and existing homes sold in this year’s third quarter were affordable to families earning the area’s median income of $68,500.
Rounding out the top five affordable major housing markets in respective order were Harrisburg-Carlisle, Pa.; Indianapolis-Carmel, Ind.; and Scranton-Wilkes-Barre, Pa.
Meanwhile, Glens Falls, N.Y. claimed the title of most affordable small housing market in this year’s third quarter. There, 92.6 percent of homes sold during the second quarter were affordable to families earning the area’s median income of $65,400.
Smaller markets joining Glens Falls at the top of the list included Sandusky, Ohio; Kokomo, Ind.; Springfield, Ohio; and Rockford, Ill.
For the 12th consecutive quarter, San Francisco-San Mateo-Redwood City, Calif. was the nation’s least affordable major housing market. There, just 10.5 percent of homes sold in the third quarter were affordable to families earning the area’s median income of $103,400.
Other major metros at the bottom of the affordability chart were located in California. In descending order, they included Los Angeles-Long Beach-Glendale.; Santa Ana-Anaheim-Irvine.; San Jose-Sunnyvale-Santa Clara.; and Santa Rosa-Petaluma.
All five least affordable small housing markets were also in California. At the very bottom of the affordability chart was Santa Cruz-Watsonville, Calif., where 16.5 percent of all new and existing homes sold were affordable to families earning the area’s median income of $87,000. Other small markets at the lowest end of the affordability scale included Salinas; Napa; San Luis Obispo-Paso Robles; and Santa Barbara-Santa Maria-Goleta, respectively.
Please visit nahb.org/hoi for tables, historic data and details.
Editor’s Note
The Housing Opportunity Index (HOI) is a measure of the percentage of homes sold in a given area that are affordable to families earning the area’s median income during a specific quarter. Prices of new and existing homes sold are collected from actual court records by Core Logic, a data and analytics company. Mortgage financing conditions incorporate interest rates on fixed- and adjustable-rate loans reported by the Federal Housing Finance Agency. The HOI is strictly the product of NAHB Economics, and is not seen or influenced by any outside party prior to being released to the public.
“Attractive home prices and interest rates, along with firming job growth, are helping housing markets across the country to gradually improve,” said NAHB Chairman Tom Woods, a home builder from Blue Springs, Mo. “While this bodes well for housing in the coming year, builders continue to face challenges, including a lack of available lots and skilled labor.”
“The decline in the index was slight and affordability remains good,” said NAHB Chief Economist David Crowe. “With mortgage rates near historic lows and home prices advancing at a modest pace, this is an excellent time to buy.”
In all, 62.2 percent of new and existing homes sold between the beginning of July and end of September were affordable to families earning the U.S. median income of $65,800. This is down from the 63.2 percent of homes sold that were affordable to median-income earners in the second quarter.
The national median home price increased slightly from $230,000 in the second quarter to $231,000 in the third quarter. Meanwhile, average mortgage rates edged higher from 3.99 percent to 4.18 percent in the same period.
Greenville and the Upstate
The index for Greater Greenville rose to 80 in the second quarter from 77.7 in the first quarter and 73.4 in the same quarter last year. House prices rose slightly while income remained the same. Greater Greenville ranks as the 76th most affordable housing market in the country.
Featured Markets
Syracuse, N.Y. was rated the nation’s most affordable major housing market, switching places with Youngstown-Warren-Boardman, Ohio-Pa., which fell to the second slot on the list. In Syracuse, 91.7 percent of all new and existing homes sold in this year’s third quarter were affordable to families earning the area’s median income of $68,500.
Rounding out the top five affordable major housing markets in respective order were Harrisburg-Carlisle, Pa.; Indianapolis-Carmel, Ind.; and Scranton-Wilkes-Barre, Pa.
Meanwhile, Glens Falls, N.Y. claimed the title of most affordable small housing market in this year’s third quarter. There, 92.6 percent of homes sold during the second quarter were affordable to families earning the area’s median income of $65,400.
Smaller markets joining Glens Falls at the top of the list included Sandusky, Ohio; Kokomo, Ind.; Springfield, Ohio; and Rockford, Ill.
For the 12th consecutive quarter, San Francisco-San Mateo-Redwood City, Calif. was the nation’s least affordable major housing market. There, just 10.5 percent of homes sold in the third quarter were affordable to families earning the area’s median income of $103,400.
Other major metros at the bottom of the affordability chart were located in California. In descending order, they included Los Angeles-Long Beach-Glendale.; Santa Ana-Anaheim-Irvine.; San Jose-Sunnyvale-Santa Clara.; and Santa Rosa-Petaluma.
All five least affordable small housing markets were also in California. At the very bottom of the affordability chart was Santa Cruz-Watsonville, Calif., where 16.5 percent of all new and existing homes sold were affordable to families earning the area’s median income of $87,000. Other small markets at the lowest end of the affordability scale included Salinas; Napa; San Luis Obispo-Paso Robles; and Santa Barbara-Santa Maria-Goleta, respectively.
Please visit nahb.org/hoi for tables, historic data and details.
Editor’s Note
The Housing Opportunity Index (HOI) is a measure of the percentage of homes sold in a given area that are affordable to families earning the area’s median income during a specific quarter. Prices of new and existing homes sold are collected from actual court records by Core Logic, a data and analytics company. Mortgage financing conditions incorporate interest rates on fixed- and adjustable-rate loans reported by the Federal Housing Finance Agency. The HOI is strictly the product of NAHB Economics, and is not seen or influenced by any outside party prior to being released to the public.
Subscribe to:
Posts (Atom)